Introduction
Let’s say FDA proposed a guidance document that would change the definition of “low cholesterol” for health claims. Now let’s say that when FDA finalized the guidance, instead of addressing that topic, FDA banned Beluga caviar. If you are interested in Beluga caviar, would you think you had adequate opportunity to comment? Would you care if FDA argued that Beluga caviar was high in cholesterol so the two documents were related?
The purpose of the notice and comment process in guidance development is to give the public an opportunity to comment on what FDA is proposing to do. The notice and comment process serves all sorts of purposes including ensuring that FDA has all the relevant information before it takes an important regulatory action. If FDA changes its mind about what to the agency will do between the proposed and the final guidance, that’s fine, but the agency still needs to give the public an opportunity to comment on the new direction(s) the agency is proposing to take. As an output of the notice and comment process, the agency is supposed to repropose the guidance with the new direction. In rulemaking, courts explain that any final rule must be a “logical outgrowth” of the proposed rule.[1]
When the failure to provide for adequate notice and comment is litigated, the parties argue about the qualitative differences and similarities between the proposed and final rule. That makes sense, but it has occurred to me that we can use quantitative evaluation techniques as an adjunct to that qualitative analysis. In this post, I’d like to show how we can use natural language processing (or “NLP”) techniques to analyze the differences between proposed and final FDA guidance documents.
Transparency
I am a practicing lawyer who represents many companies in matters before the FDA, so frankly I have a bias in all these monthly posts. But I want to point out here that I am actively opposing FDA’s publication of the Final Guidance on Clinical Decision-Support Software (or “CDS Guidance”)[2] published on September 28, 2022. As a result, I would encourage you, if you have concerns about my conclusions, to check my math.
Guidance Documents Analyzed
I analyze the development of four guidance documents here, starting with the Final CDS Guidance compared to the proposed guidance in 2019. I picked the final CDS guidance because it’s a matter of current controversy regarding how it was developed.
I also analyze the original 2015 Final Guidance on Medical Device Data Systems, Medical Image Storage Devices, and Medical Image Communications Devices (or “MDDS Guidance”) compared to the earlier draft guidance from 2014.[3] For comparison purposes, I picked the MDDS guidance not at random, but instead because I thought it was a fairly similar situation. I believe agency guidance development depends on many factors, and these two guidance documents seem similar in that they were both developed on a digital health topic to define products that FDA should not regulate. Indeed, the MDDS guidance was rather groundbreaking in 2014 because FDA was proposing a significant deregulation of certain hardware and software. It was quite controversial, even though looking back people may wonder why FDA ever regulated those items.
To add some other comparable documents, I include the first Final Guidance on Mobile Medical Applications[4] (“MMA”) from 2013 as well as the first Final Guidance on General Wellness Policy for Low-Risk Devices[5] (“Wellness”) published in 2016. As with the other two guidances, these were in their day cutting edge efforts by FDA to deregulate mobile apps, as well as software and other products used for wellness.
Since we are focusing on the differences between the proposed and final guidance documents, intuitively you might expect there to be fewer differences in the finalization of the CDS guidance compared to the other 3 guidances because:
- The CDS guidance went through an earlier 2017 draft, and so you would expect the 2019 draft to be more in line with what the agency would ultimately do, whereas the other 3 guidances only went through one round of proposal, and
- The CDS guidance was interpreting a specific statute, while the other 3 guidances were a matter of FDA discretion as the agency was defining an area of enforcement discretion not specified by statute at time.
Not to spill the beans, but if you think that, you’d be wrong.
To see the old proposed and final guidances, follow the links provided, click on the docket number link, and it will take you to the file at regulations.gov where you can access not only all the old drafts but also the public comments received.
Results
Let me start by giving you the numbers:
| Guidance | Length in Words (proposed / final) | Distinct Words (proposed / final) | Jaccard Similarity | Cosine Similarity | Word Mover’s Distance |
| MMA | 9738 / 13802 | 1818 / 2148 | 0.435 | 0.987 | 0.298 |
| Wellness | 2836 / 3458 | 713 / 784 | 0.716 | 0.987 | 0.224 |
| MDDS | 2032 / 1717 | 491 / 508 | 0.549 | 0.907 | 0.378 |
| CDS | 11627 / 11433 | 2043 / 1514 | 0.346 | 0.838 | 0.475 |
I’ll spend the rest of this post explaining these results.
Analysis
Document Length
I start off the table by disclosing the document length, both overall and regarding distinct words, because those can affect the calculations. The changes in a shorter document can be more impactful simply because the document is shorter.
In this case, though, you can also see something significant in the data. The number of distinct words changed barely at all between draft and final for the MDDS guidance. For the CDS guidance, however, even though the document was shortened only slightly overall, the number of distinct words dropped by about 25%. That’s a lot.
I obviously read the two documents, and I know why that change in length occurred. Among other things, FDA remove the entire discussion of the International Medical Device Regulators Forum risk framework from the CDS guidance document.
I think the two sets of data—total length and distinct words-- read together are particularly revealing though. While dropping the number of distinct words considerably in the CDS guidance, the overall length didn’t change that much. That means FDA added quite a bit of discussion to the final CDS guidance that hadn’t been there to start, making up for the deletions. And unless FDA was simply being verbose in moving from the draft to the final (i.e., saying the same thing but with more words), the agency added much substantive content to the final version.
For the MDDS guidance, the agency trimmed the overall length of the guidance, while adding just a few additional words. This suggests that the finalization resulted mostly from dropping content, although the agency also added something that included at least 17 new words.
Notice that the Wellness guidance grew some, and the MMA guidance grew significantly. Indeed, the MMA guidance went from 29 pages to 43 pages. A lot of the growth in the MMA guidance can be attributed to the agency adding more background and context on FDA regulation that was not controversial and indeed taken from other published materials, but FDA decided that it would be handy for developers to have all that information in one guidance document. That shouldn't be a problem for notice and comment, but it's also one of the reasons why a simple quantitative analysis will never be sufficient to evaluate compliance with the notice and comment requirements. It really does matter what was added and what was taken out. These quantitative techniques are merely an adjunct to understand the magnitude of the qualitative changes that were made.
Jaccard Similarity
The more important metric, and indeed I submit the most important metric in the table for these purposes, is the Jaccard Similarity. The Jaccard Similarity is a technique that was developed in part to help detect plagiarism. It is a metric that software used in schools often employs to determine whether students have lifted, without due credit, language from other papers in writing their own. I think that makes it quite useful here, since the goal is to figure out how much of the draft FDA left the same versus how much the agency changed.
In this case, by analyzing the words used, I calculate Jaccard Similarity by using the intersection of two documents divided by the union of those two documents. Specifically, I calculate the number of common words divided by the total number of words, whether in common or not. Thus, if two documents are identical, they will have the same number of words in common as they do the union of words. In other words, the ratio will be one. If the two documents have absolutely no words in common, say one is in French and the other is in English, there will be zero words in common over the total number (union) of words from both documents, or zero.
Your reaction might be that this sounds kinda crude and simplistic. In some ways I suppose it is. But recognize that for longer documents, the usefulness increases. If we were comparing two short sentences, just a couple of words different would make a very large difference. But if we are comparing an FDA medical device guidance document with, say, a Shakespearean sonnet, given the length of the documents, the difference would be apparent and meaningful. Recognize, though, that in most cases the Jaccard Similarity will not approach zero if both documents use English language, since there’s bound to be some intersecting vocabulary even if the topics and style are quite different.
Of the four documents, the CDS guidance is distinctly lower, meaning less similar to its draft. The next closest is the MMA guidance, which as mentioned previously, FDA decided to add a bunch of content just for convenience even though it was taken from other documents. But think about that. FDA added 14 pages of content to the MMA final guidance and it was still more similar to its draft than the CDS guidance was to its draft.
The MDDS and Wellness guidances were even more similar to their drafts.
While it’s hard to give much exact interpretation to the actual score, mathematically it means that when comparing the draft to the final CDS guidance, only roughly 1/3 of the words used were common to both. That is exceedingly little overlap. While in school that would mean the student did not plagiarize the other document, here it means that FDA did not use much of its draft in fashioning its final CDS guidance.
Cosine Similarity
Cosine Similarity is a useful metric when the two documents being compared have radically different lengths. One of the weaknesses of Jaccard Similarity is that mathematically it would be skewed if one document of the two being compared – draft and final – had lots more words. Cosine similarity is not affected by the length of the documents being compared, and like Jaccard Similarity, zero means that the two documents are not addressing the same topic where a score of one means that they are identically directed.
In this case, statistically speaking, there isn’t much difference in size between the draft and final for all but the MMA guidance. As already noted, the MMA guidance grew substantially from draft to final by the addition of content taken from other documents. Since the draft and final guidances are pretty similar in length for all but the MMA, I find Jaccard Similarity to be more useful, in addition to the fact that it’s also easier to interpret. As a further consideration, Cosine similarity would be better if we had a lot of duplicate data within each document, but that’s not the case here.
There are different ways of calculating cosine similarity, for example regarding how the data are preprocessed before they are analyzed. I used the sklearn library, and I played around with different preprocessing, for example using both CountVectorizer and TfidVectorizer, and those changes didn’t make much difference for this particular analysis.
The bottom line was the CDS guidance again had distinctly lower similarity to its draft than the other three guidance documents. You might not think that 0.1 is significant, but it is when you consider that the range is from complete similarity to absolutely no similarity within the span of 1.0. You might get close to zero if you compared two documents in two different languages, since the analysis involves looking at common words. But almost any two English language documents will have at least a certain number of words in common even if they deal with distinctly different topics.
Word Mover’s Distance
At this point, you might still be unimpressed with the crudeness of these tools. They are in some ways a rather blunt instrument. Researchers realize the crudeness, and have been working on improved methods.
Here’s a problem that researchers noted. The following two sentences have no substantive words overlapping, but mean something pretty similar.
- Obama speaks to the media in Illinois
- The President greets the press in Chicago
That illustration is one now commonly discussed, but I think it’s origin is in this blog.[6]
Software interprets those as different because the software, by itself, doesn’t understand the words. Thus, mere differences in words suggest to the software different meaning, when actually in English that’s not the case. So what we do about that?
We teach the software to understand the meaning of the words. We do this through the creation of what is called a language model.
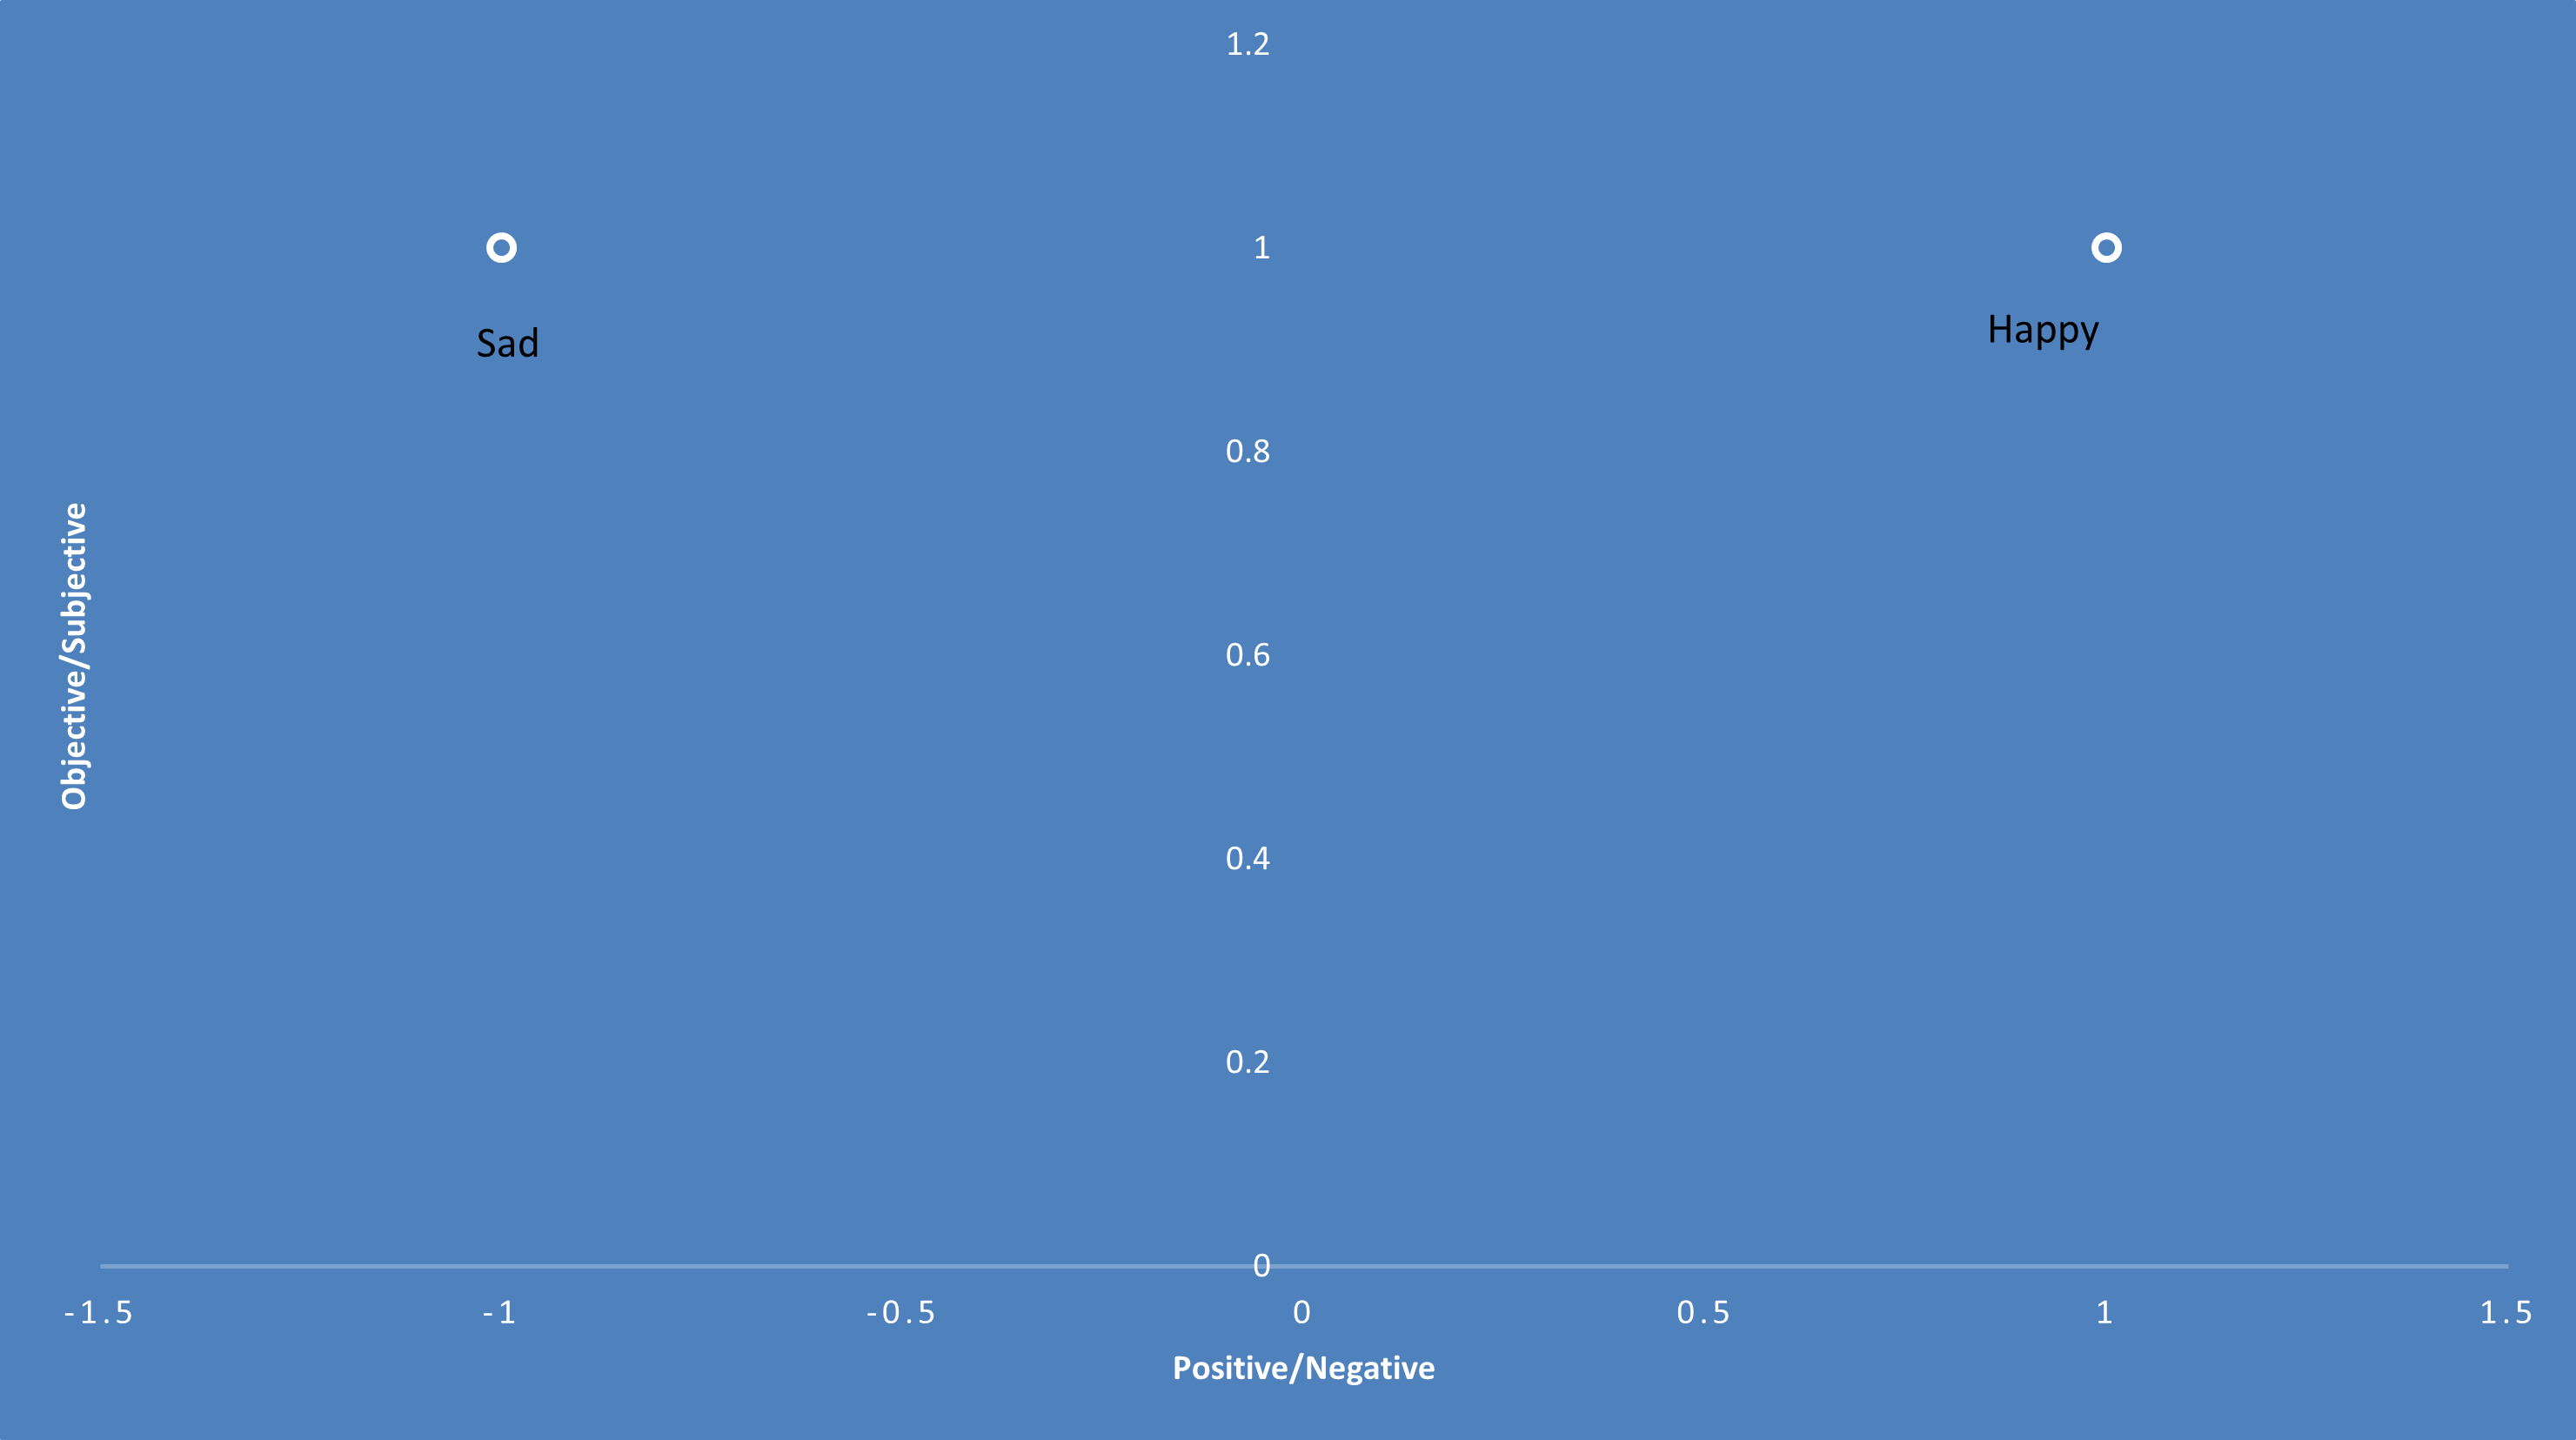
A language model is a mathematical representation of a vocabulary set. In other words, each word is depicted by a set of numbers. In very simple terms, imagine we had two words: “happy” and “sad.” I could represent the meaning of those words crudely in two dimensions. The first dimension might be positive versus negative. The second dimension might be objective versus subjective, to capture the fact that those are feelings. Thus, I could draw a two-dimensional graph and place both words toward the subjective end of the graph, but the word “happy” toward the positive end of the other dimension and “sad” toward the negative end of that dimension.
That’s just two dimensions, but in mathematics I’m not limited to two. As a result, researchers create high dimensional mathematical representations of words to get more accuracy as to what a given word means.
When I looked at the existing language models, I found, for example, Google’s 300-dimension model that was created by having a machine learning algorithm read many news stories. But I decided not to use it because I was concerned that much of the language used in FDA regulatory affairs is perhaps idiosyncratic to the field. Thus, I decided to create my own language model.
To create a model, I use the nltk and gensim libraries. Essentially, I trained an algorithm by asking it to read all the existing FDA medical device guidance (almost 600 documents) and about 40,000 510(k) summaries that spans the last roughly 20 years. I thought between the two sources, an algorithm could learn the pertinent words.
Admittedly, I haven’t rigorously tested my model, but I did anecdotally test it by asking it to identify words similar to a given word I selected. So, for example, I wanted to see what my model would say was similar to the word “software” and these were the top three words:
- ('hardware', 0.52193284034729)
- ('workstation', 0.5049660205841064)
- ('firmware', 0.47813695669174194)
I think that’s not bad for a language model.
As a result, with that model in hand, I could do a comparison of the two documents on a more semantic level, comparing the meaning of the words in the two documents, not just a literal comparison of the words used. To do this, I used an algorithm called the Word Mover’s Distance.
In looking at the scores, it’s important to understand that zero means the documents have the identical meaning, and the larger the number from zero, the more difference there is in meaning. In that sense it's the opposite of the similarity scores. It’s also important to understand that I normalized the vectors so that they would range from 0 to 1. As a result, again, a mere 0.1 difference is quite significant.
The scores listed show that even on a semantic level, the CDS guidance is distinctly more different between draft and final than the other three guidance documents analyzed. I wouldn’t try to necessarily interpret or characterize each 0.01 increment of difference as I don’t think the differences are linear. But nonetheless, as with the other measures, the CDS guidance changed the most during the transition from draft to final.
Conclusion
What does all this mean? It means in comparison to other similar guidance documents published by FDA, the CDS guidance changed far more in moving from draft to final. Why is that important? It means the public had less opportunity to anticipate and comment on the approach that FDA ultimately took in interpreting the underlying CDS statute.
Soon I will be asking FDA to rescind the final guidance and instead declare it to be a new draft and to solicit public comment. In that request, I will articulate a more qualitative comparison between draft and final. But to my way of thinking, this quantitative analysis helps us understand the quantitative significance of the qualitative differences between the draft and final.
* * * *
The Unpacking Averages® blog series digs into FDA’s data on the regulation of medical products, going deeper than the published averages. The opinions expressed in this publication are those of the author(s). Subscribe to this blog for email notifications.
ENDNOTES
[1] https://www.yalejreg.com/nc/the-logical-outgrowth-doctrine-and-fdas-intended-use-revisions/
[2] https://www.fda.gov/regulatory-information/search-fda-guidance-documents/clinical-decision-support-software
[3] https://www.fda.gov/regulatory-information/search-fda-guidance-documents/medical-device-data-systems-medical-image-storage-devices-and-medical-image-communications-devices
[4] https://www.fda.gov/regulatory-information/search-fda-guidance-documents/policy-device-software-functions-and-mobile-medical-applications
[5] https://www.fda.gov/regulatory-information/search-fda-guidance-documents/general-wellness-policy-low-risk-devices
[6] https://vene.ro/blog/word-movers-distance-in-python.html